While major commodities like gold and silver alongside benchmark equity indices such as the S&P 500 and Nasdaq have traded near historic highs, the digital asset market has undergone an extended phase of range-bound consolidation. In this late-stage phase of debt-driven global liquidity expansion, we examine the structural mechanics behind potential capital rotation from overextended traditional markets into high-beta alternative assets, alongside the accompanying macroeconomic downside risks.
[Author's Perspective]

A seasoned investor's perspective: discerning structural fragility behind market euphoria.
Navigating multiple macroeconomic cycles teaches a sobering lesson: market rallies sustained primarily by expanding sovereign debt and artificial liquidity injections inherently carry structural vulnerabilities. When authorities deploy balance-sheet maneuvers to bridge the gap until real productivity gains materialize, capital inevitably seeks out remaining asymmetric returns in relatively lagging asset classes.
However, experienced market participants avoid meeting late-cycle liquidity expansions with uncritical exuberance. While capital rotation triggered by stretched equity valuations can ignite sharp short-term momentum, it remains a double-edged sword capable of triggering severe corrections when policy conditions shift. Preserving capital through objective metrics and disciplined risk management must always take precedence over emotional momentum.
1. Global Macro Dynamics and Surplus Liquidity Transmission

The rotational flow of surplus liquidity moving from massive traditional asset pools toward the digital asset ecosystem.
As valuation pressures mount across traditional asset classes, several structural catalysts could drive surplus global liquidity toward digital assets.
① Compressing Risk-Reward Profiles in Traditional Equities and Rotational Demand
As primary indices and safe-haven assets reach the upper boundaries of historical valuation bands, the downside risk relative to potential upside capture becomes increasingly unfavorable for new capital deployments. Consequently, institutional allocators may consider portfolio diversification into lagging alternative sectors that have absorbed prolonged price corrections.
- Counter-Risk : Broad macroeconomic shocks could trigger simultaneous deleveraging across all risk-on asset classes, erasing diversification benefits.
② Market Capitalization Disparities and High Beta Elasticity
Compared to the broader global financial landscape, the aggregate footprint of digital assets remains remarkably modest. Global real estate encompasses hundreds of trillions of dollars, the OTC derivatives complex exceeds a quadrillion dollars in notional exposure, and sovereign debt and major stock exchanges represent tens of trillions. Notably, the combined market capitalization of just the top 10 global tech firms surpasses the entire cryptocurrency asset class.
Because of this pronounced scale difference, if even 1% to 2% of surplus institutional liquidity rotates out of traditional asset pools, the shallow market depth and narrow entry channels could amplify price responsiveness (beta) significantly.
Note: Estimated market valuations reflect baseline data for the second half of 2026.
- Counter-Risk : Due to the symmetrical nature of volatility, liquidity drawdowns or sudden drying up of bid-side depth can trigger steep, accelerated declines.
③ Institutional Rail Maturation and Regulatory
Clarity Unlike earlier cycles, capital access is no longer constrained to unregulated venues. Regulated spot exchange-traded funds (ETFs) provide direct custodial access, while comprehensive legislative frameworks—such as the Clarity Act establishing distinct regulatory jurisdictions between securities and commodities, and the GENIUS Act fostering institutional technology integration—provide the legal clarity required for conservative balance sheets to participate.
- Counter-Risk : Deeper institutional integration increases cross-asset correlation with traditional equities, potentially diminishing digital assets' historical role as an uncorrelated hedge during systemic sell-offs.
2. Phased Market Cycle Dynamics and Structural Downside Vulnerabilities
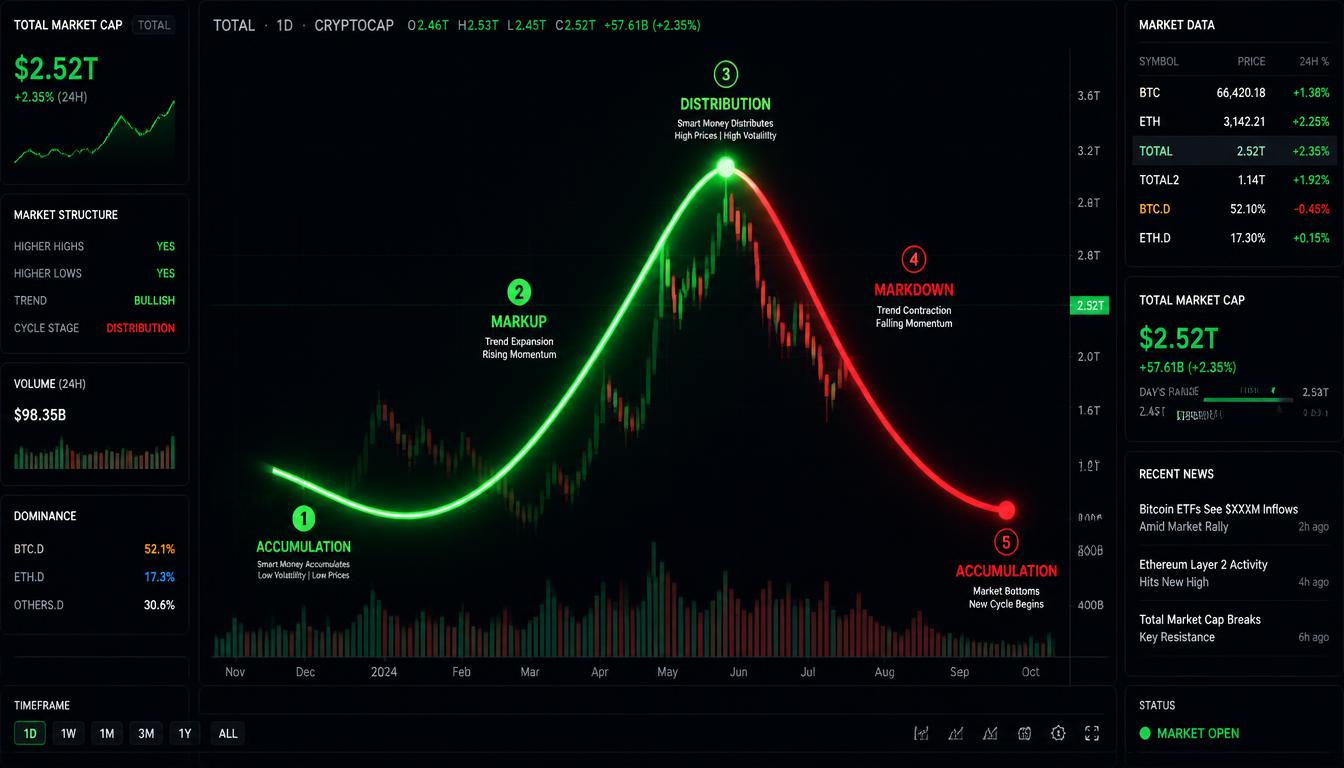
Phased market cycle dynamics: from liquidity-driven expansion to late-stage structural contraction.
From the initial fiscal and political catalysts that inject liquidity, to the peak concentration of capital into high-beta alternative assets, and through to the subsequent contraction as policy conditions normalize, the progression of the market cycle and its accompanying structural risks unfold across three distinct phases.
① Phase 1 : Liquidity Preservation and Accommodation (Fiscal Time-Buying)
- Structural Mechanics: To curb sudden spikes in sovereign bond yields and mitigate economic slowdowns, governments and central monetary authorities implement artificial stabilization measures—such as Treasury buyback programs—while deferring interest rate hikes. This functions as a temporary shock absorber, lowering systemic debt servicing costs until real productivity gains (such as tangible returns from AI infrastructure investments) can materialize across the broader economy.
- Accompanying Structural Risks: Artificially suppressing yields and defending money supply levels inevitably accumulates underlying inflationary pressure. Concurrently, heavy debt issuance increases the term premium and widens real yield volatility, progressively eroding the underlying resilience of financial markets.
② Phase 2 : High-Beta Capital Rotation and Expansion (Late-Stage Momentum)
- Structural Mechanics: With traditional equities and raw commodities trading at historically stretched valuations, ongoing short-term liquidity pushes capital toward lagging high-beta asset classes in search of asymmetric returns (alpha)—specifically Bitcoin and high-tier digital assets. Bolstered by shallow aggregate market depth and emerging regulatory frameworks (such as the Clarity Act and the GENIUS Act), surplus capital flows into narrow market channels, creating acute supply-demand imbalances that drive rapid upward price momentum.
- Accompanying Structural Risks: Because this expansion is propelled by rotational capital flows and leveraged positioning rather than organic fundamental growth, open interest and funding rates in derivatives markets become excessively elevated. This structural imbalance leaves the market vulnerable to sharp downside cascades (long squeezes) triggered by minor macro headlines or sudden liquidity fluctuations.
③ Phase 3 : Policy Normalization and Liquidity Contraction (Prolonged Correction)
- Structural Mechanics: Once key political milestones (such as major elections) pass or fiscal bandwidth reaches its operational limits, market scrutiny shifts back to accumulated sovereign debt levels and stubborn inflation data. Central banks often pivot back toward hawkish postures through interest rate adjustments or balance-sheet contractions, or sovereign bond markets reject artificial yield controls, causing market rates to re-accelerate higher.
- Accompanying Structural Risks: When artificial liquidity injections subside, the fresh capital required to sustain elevated asset prices rapidly dries up. High-beta alternative assets that experienced rapid upward acceleration face sudden order-book voids on the bid side, exposing the market to prolonged bear phases, structural repricing, and extended consolidation periods before prior cycle highs can be sustainably revisited.
| Market Cycle Phase | Macro & Policy Environment | Asset Class Reactions & Dynamics | Core Structural Risk Factors |
| Phase 1: Liquidity Preservation & Accommodation | US Treasury buyback execution, monetary policy pauses, fiscal liquidity buffers. | Traditional equities sustain upper valuation bands; persistent strength across safe-haven assets. | Latent inflationary pressure, rising bond term premia, and real yield instability. |
| Phase 2: High-Beta Capital Rotation | Rotational flows into lagging sectors, market optimism surrounding regulatory frameworks. | Sharp upward price momentum across high-beta assets including Bitcoin and major digital assets. | Derivatives market overheating, leverage liquidation cascades, and fundamental decoupling. |
| Phase 3: Policy Normalization & Contraction | Post-political event policy recalibration, quantitative tightening resumption, liquidity absorption. | Broad-based price corrections across risk assets accompanied by declining trading volume. | Exhaustion of fresh buy-side capital, protracted bear cycles, and structural liquidity deficits. |
3. Objective Indicator Monitoring and Systematic Risk Management Frameworks

Systematic risk management guided by objective on-chain indicators and macroeconomic data.
During late-stage market cycles characterized by heightened volatility, participants must filter out speculative euphoria and emotional fear, anchoring their portfolio decisions in verifiable data and disciplined operational rules.
① Intermediate Moving Averages and On-Chain Overheating Indicators (Platform & Metric Guide)
Even novice market participants can directly evaluate underlying market conditions using established analytics suites and technical indicators:
- Technical Moving Average Confluences via TradingView:
- Access: Open a TradingView terminal and load the Bitcoin daily (1D) or weekly (1W) price chart.
- 50-Day / 200-Day Simple Moving Averages (SMA): Track whether the short-term trend crosses above the long-term trend (Golden Cross) or breaks below it (Death Cross). A historically wide spread between these two moving averages frequently signals short-term overextension.
- 50-Week Moving Average: Serves as a macro boundary separating structural bull regimes from multi-year consolidation phases.
- Derivatives Positioning via Coinglass:
- Access: Navigate to Coinglass and review the 'Funding Rate' and 'Open Interest' dashboards.
- Funding Rates: Measures the cost imbalance between long and short perpetual contracts. Excessively elevated positive funding rates reflect heavy long bias and heightened exposure to long-squeeze cascades.
- Open Interest (OI): Tracks aggregate unsettled derivative contracts. A sharp spike in open interest alongside surging spot prices typically indicates aggressive leverage build-ups.
- On-Chain Valuation Multiples via Glassnode and CryptoQuant:
- MVRV Z-Score: Evaluates the deviation between market capitalization and realized capitalization. Readouts exceeding 5 to 6 historically reflect late-stage cycle overheating.
- Net Unrealized Profit/Loss (NUPL): Measures network-wide unrealized gains versus losses, helping identify when aggregate market sentiment crosses into the 'Euphoria' threshold.
② Phased De-Risking and Liquidity Management Strategies
[Risk Disclaimer] The capital allocation, staged rebalancing, and profit-taking frameworks described below are illustrative examples of standard risk-mitigation methodologies, not formal investment advice or mandatory trading instructions. Asset allocation adjustments and execution timing must be independently evaluated by each investor based on individual risk tolerance, tax jurisdiction, and personal financial objectives.
- Staged, Milestone-Based Profit Realization : Rather than attempting to pinpoint exact cycle tops, establish predetermined return bands (e.g., trimming 10%–20% of an allocation at designated milestone gains) to systematically lock in gains.
- Preserving Stablecoin and Cash-Equivalent Reserves : Accumulating liquid reserves cushions the portfolio against sudden market contractions while providing dry powder to redeploy once valuations normalize.
- Principal Protection Rule : As late-stage momentum accelerates, de-risking the original principal allocation helps insulate the portfolio emotionally and financially, allowing only unrealized gains to ride the remaining trend.
③ Essential Macroeconomic Indicators and Tracking Portals (Top 10)
A curated dashboard of 10 macroeconomic gauges and official data sources for monitoring systemic liquidity conditions:
- US 10-Year Treasury Yield Acts as the benchmark risk-free rate and global discount factor for risk assets. Reference: CNBC US 10-Year | MarketWatch US10Y
- FedWatch Tool (Target Rate Probabilities) Measures real-time market-implied probabilities for upcoming Federal Open Market Committee (FOMC) interest rate decisions. Reference: CME FedWatch Tool
- Federal Reserve Total Assets (WALCL) Tracks central bank balance sheet expansion or Quantitative Tightening (QT) trajectories. Reference: FRED - Total Assets (WALCL)
- Treasury General Account (TGA) Balance The US Treasury’s operational cash balance held at the Federal Reserve; drawdowns release liquidity into the banking system. Reference: FRED - Treasury General Account
- Overnight Reverse Repurchase Agreements (RRPONTSYD) Absorbs surplus institutional liquidity; declining balances historically signal capital migration into broader yield-bearing assets. Reference: FRED - Overnight Reverse Repurchase Agreements
- Consumer Price Index (CPI) and Core CPI Evaluates underlying inflationary momentum that dictates central bank policy stances. Reference: BLS CPI Releases | FRED - Consumer Price Index
- ISM Manufacturing PMI A key leading economic indicator where readings above 50 signal expansion and below 50 reflect contraction. Reference: Institute for Supply Management (ISM) | Investing.com ISM PMI
- US Dollar Index (DXY) Measures the greenback against a basket of major currencies; historically shares an inverse correlation with alternative assets. Reference: MarketWatch DXY | TradingView DXY
- 10-Year Minus 2-Year Treasury Yield Spread (T10Y2Y) Yield curve inversion and subsequent un-inversion serve as classic leading signals for broader macroeconomic regime shifts. Reference: FRED - 10-Year Minus 2-Year Spread
- Crypto Fear & Greed Index Aggregates volatility, volume, and social sentiment metrics to measure short-term psychological extremes across market participants. Reference: Alternative.me Fear and Greed Index
Concluding Reflections : The Discipline of Longevity
Entering my tenth year participating in the digital asset ecosystem—having witnessed the explosive bull run of 2017, the missed profit-taking opportunities that followed, and the sobering bear cycles that reshaped the industry—one reality remains constant: navigating this market never becomes effortless. While studying macroeconomic cycles, on-chain metrics, and technical signals provides a structural compass, the true determinant of long-term survival is emotional restraint.
The most resilient strategy has never been catching the exact bottom or selling at the absolute peak. Instead, it lies in accumulating high-conviction assets when broad market interest is dormant or despondent, and methodically scaling out into cash reserves when broad market euphoria takes hold. Protecting capital through disciplined rebalancing ensures that when the next structural shift occurs, you retain both the financial capacity and the clarity to participate.
General Market Disclaimer :
This publication is compiled exclusively for analytical, educational, and informational purposes and does not represent financial, legal, tax, or investment advice. The macroeconomic data, on-chain metrics, market valuations, and third-party references included herein are sourced from public platforms believed to be reliable; however, their ongoing completeness and real-time accuracy cannot be guaranteed. Capital allocation in digital and alternative assets carries substantial capital risk, including the potential for total principal loss. Readers must conduct independent due diligence, evaluate their personal risk capacity, and consult licensed advisory professionals before executing any financial transactions.
[Deep Dive]
To gain a deeper understanding of macroeconomics, crypto, and institutional changes within the asset market, I highly recommend reviewing the analysis materials I have previously written.
The Hidden Debt of Big Tech: Why 600% Spike in CDS Signals an AI Bubble?
The Hidden Debt of Big Tech: Why 600% Spike in CDS Signals an AI Bubble?
[Disclaimer]This content is provided for informational purposes only and does not constitute financial, investment, legal, or tax advice. All investment decisions are at the sole discretion of the reader. Please be aware that all investments involve risk,
cryptoteslaglobal.com
Ethereum : The Operating System for the New Digital Finance
Ethereum : The Operating System for the New Digital Finance
Why Wall Street is Obsessed with the "World Computer" (2026 Updated)"This is not just another cryptocurrency. It is the operating system (OS) for the new digital economy."While Bitcoin acts as 'digital gold'—a store of value—Ethereum is the 'World Comp
cryptoteslaglobal.com
JPMorgan Calls Bitcoin a Fraud: Why They Secretly Built on Solana?" [2026 Updated]
JPMorgan Calls Bitcoin a Fraud : Why They Secretly Built on Solana?" [2026 Updated]
The Emperor of Wall Street is dancing on the blockchain.Why is JPMorgan, a vocal critic of Bitcoin, secretly betting on Solana? The answer lies in the shift toward institutional-grade infrastructure.The greatest irony in modern finance is currently unfoldi
cryptoteslaglobal.com